WEEKLY MARKET OUTLOOK
The Indexes are Holding Up, but This is Not the Market Environment to Press
Weekly Market Outlook | August 31, 2026

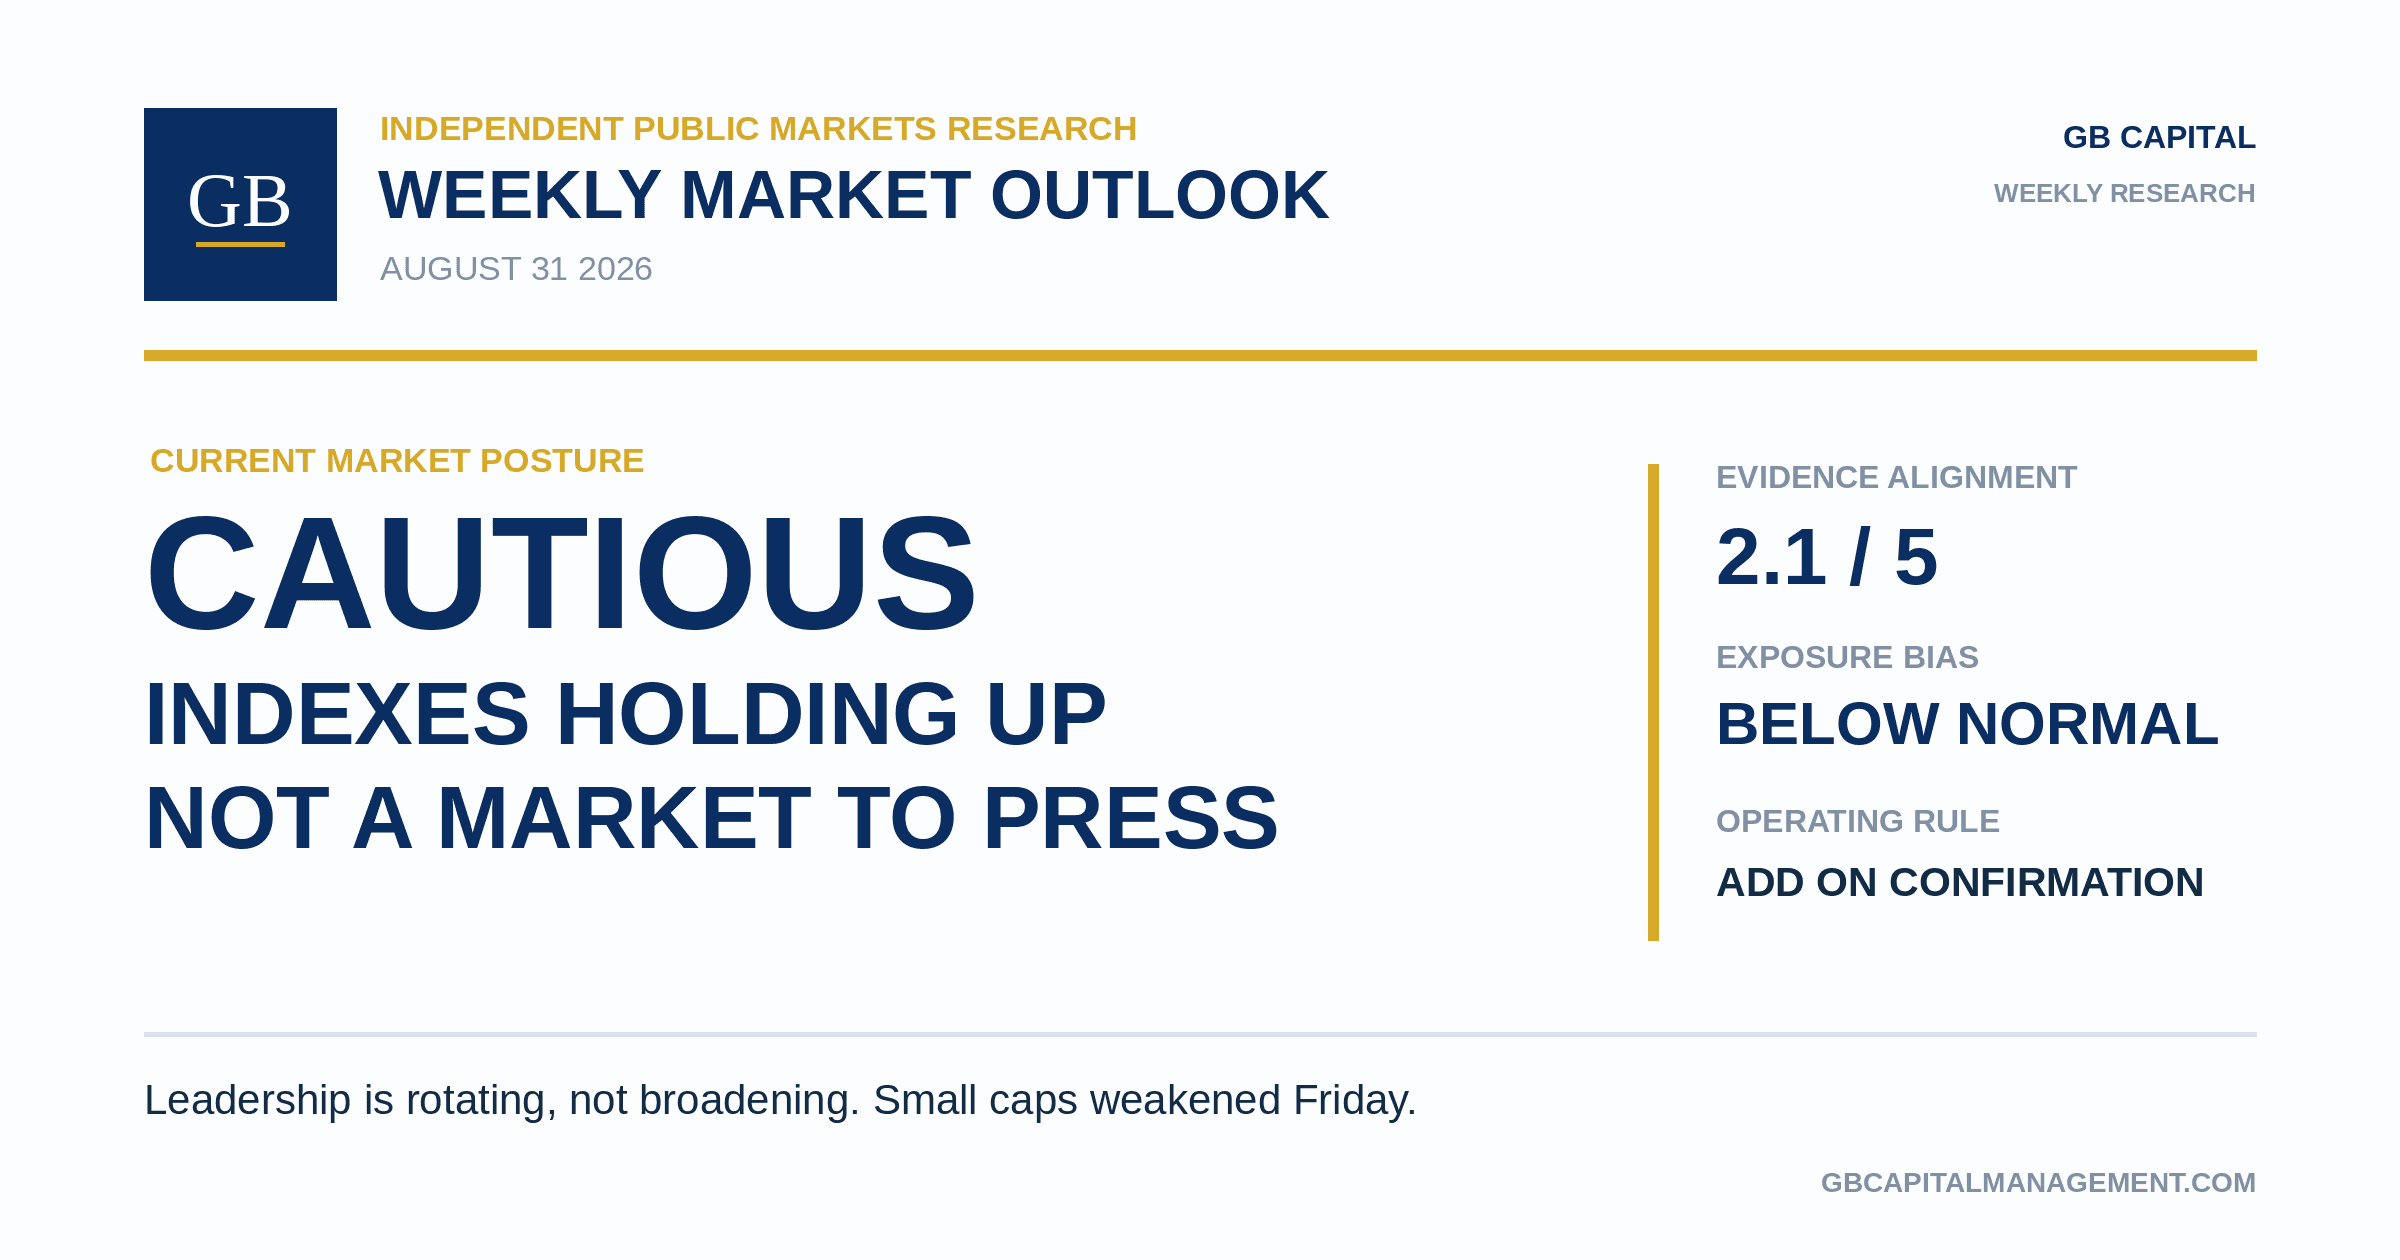
CURRENT POSTURE Neutral and evidence dependent. The longer term index structure remains intact, but leadership, breadth, setup proliferation, and position feedback are not strong enough to justify pressing. Hold proven leaders, keep new exposure selective, and require the market to earn greater aggression.
The 60 Second Read
Evidence | Current read | Why it matters |
|---|---|---|
Primary trend | Constructive | SPY and QQQ remain above rising longer term moving averages. |
Market character | Choppy and rotational | QQQ has repeatedly crossed its 21 day and 50 day averages since late May. |
Leadership | Fragmented | Strength is moving between unrelated themes rather than expanding broadly. |
Risk appetite | Selective | Bitcoin and software are working while small caps and several former growth leaders remain in repair mode. |
Breadth | Uneven | IWM weakened Friday, and index resilience has not yet translated into consistently broad participation. |
Sentiment | Calm, not fearful | The VIX closing Friday at 14.42 shows limited demand for protection but offers no panic washout signal. |
Setup proliferation | Insufficient | Former leaders are rebuilding, but completed setups and lasting follow through remain scarce. |
The Chart That Explains the Last Three Months
QQQ peaked at 748.65 in late May. Since then, it has experienced a sharp correction, a meaningful recovery, and several attempts to establish a new direction. None of those attempts has yet produced a sustained trend.
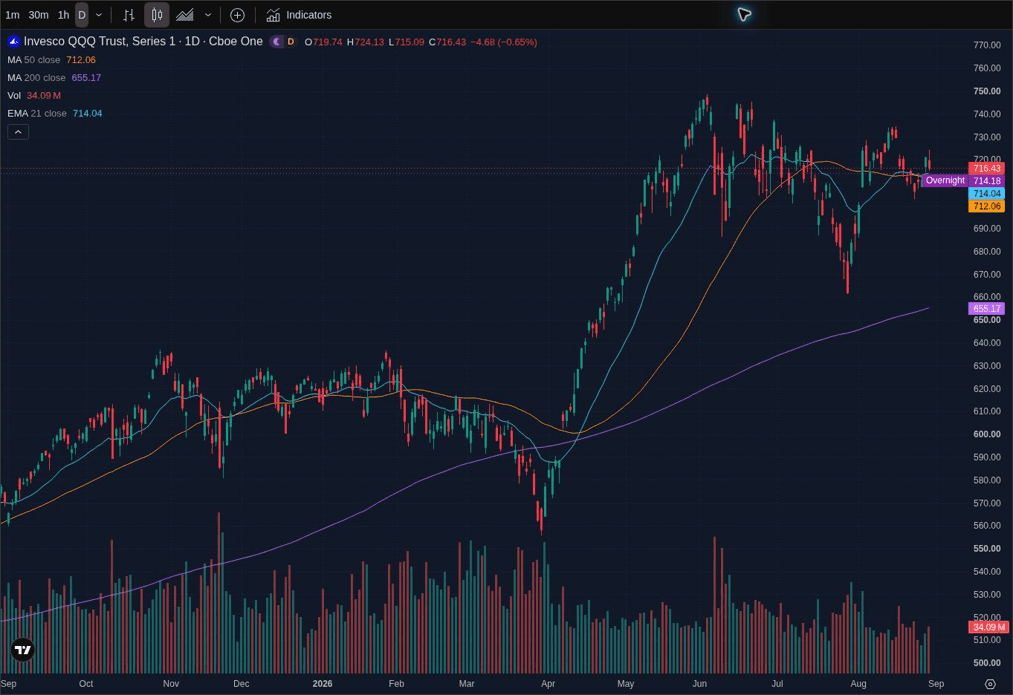
QQQ peaked in late May and has since moved through repeated reversals without establishing a durable new trend. Moving average guide: 21 day EMA (baby blue), 50 day SMA (orange), and 200 day SMA (purple). Source: TradingView. Analysis: GB Capital. Price data through August 28, 2026.
This chart is the clearest summary of the summer. The index has moved considerably without making durable progress. Strength has attracted buyers, but not enough sustained demand to produce a lasting expansion. Weakness has created concern, but not enough sustained selling to break the primary trend.
That environment naturally produces rotation. When one area stops working, capital moves toward the next source of momentum. The result is a market containing plenty of activity but relatively few trends that last long enough to become meaningful.
For my process, the distinction is critical. I am not looking to capture every short term fluctuation. I am looking for liquid leaders that can emerge from constructive structures and develop into intermediate or longer term trends. The market has offered plenty of the first move. It has offered much less continuation.
What Happened to the Former Leaders?
Many of the most speculative leadership areas from earlier in the year experienced substantial corrections after QQQ peaked. Memory, semiconductors, fiber optics, robotics, and other higher growth technology groups gave back meaningful portions of their prior advances.
There is nothing inherently abnormal about that process. Strong sectors cannot advance indefinitely without correcting. After large moves, leaders often need to decline in price, spend time moving sideways, or experience some combination of both. Moving averages catch up, volatility contracts, weaker holders exit, and a new balance between supply and demand starts developing. That is how new bases form.
The key distinction is between a stock that is simply no longer declining and one that has completed the repair process required to begin another sustained advance. Several former leadership areas now appear to be stabilizing and attempting to build new bases. That is constructive enough to deserve attention. It is not enough to establish confirmation.
Over the past two to three months, the recurring problem has been follow through. A theme begins strengthening, a stock breaks out, or a short term trend appears to be forming, only for the move to be sold and the stock to return to its prior range. The market has produced movement. It has produced far fewer lasting trends.
Leadership Is Rotating, Not Broadening
To measure leadership independently, I selected a fixed group of liquid ETF proxies and compared their one month and three month price returns. The purpose is not to crown a permanent winner. It is to see whether recent strength is persisting across timeframes or merely rotating from one pocket of the market to another.
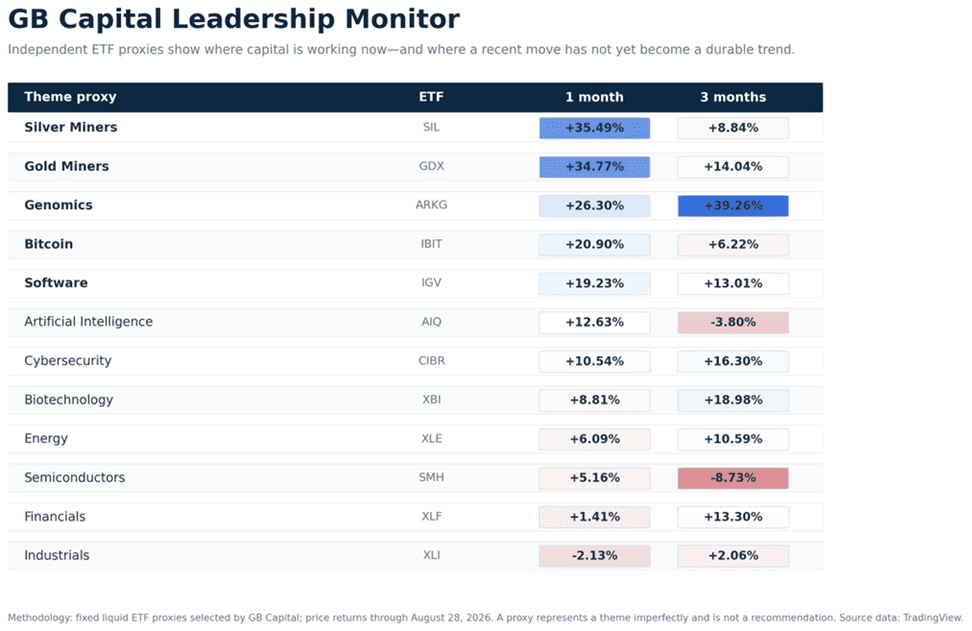
Precious metal miners and genomics lead the latest month, while the three month view favors genomics, biotechnology, cybersecurity, gold miners, and financials. The mismatch between horizons is evidence of rotation rather than uniform broadening.
What the Timeframes Say
Genomics is the clearest multi timeframe leader: ARKG gained 26.30% over one month and 39.26% over three months.
Precious metal miners produced the strongest one month moves: SIL gained 35.49% and GDX gained 34.77%, versus more moderate three month returns.
Bitcoin’s move is recent rather than mature: IBIT gained 20.90% over one month but 6.22% over three months.
Software is improving across both horizons: IGV gained 19.23% over one month and 13.01% over three months.
Semiconductors remain in repair mode: SMH gained 5.16% over one month but remained down 8.73% over three months.
The practical takeaway is that leadership exists, but it is not moving as one coherent risk on wave. Some former leaders are rebounding, some defensive or commodity linked areas are strong, and Bitcoin and software are attracting fresh interest. That mixture can produce opportunities, but it also explains why a breakout in one group has repeatedly failed to translate into lasting follow through across the market.
This is not a market without leadership. It is a market where leadership keeps changing. Broadening would mean that strength spreads into related industries, more stocks participate, and successful trends reinforce one another. Rotation means capital moves from one area to another without expanding the total opportunity set. The evidence still favors rotation. Software deserves particular respect because it ranks among the leaders over both one month and three months, although it still needs broader participation and durable follow through before it qualifies as broad leadership.
Bitcoin Is the Clearest Exception
Bitcoin has produced the clearest recent evidence that speculative appetite remains alive. It awakened at almost exactly the kind of moment it often does: after attention had faded, trading had become unusually quiet, and relatively few people seemed interested.
The move matters because it shows that investors remain willing to pursue risk when a compelling theme emerges. What happens next matters more than what has already happened. If Bitcoin holds its advance and strength spreads into crypto related equities, financial technology, software, semiconductors, and other higher beta areas, it could become evidence of a broader change in character. If the move remains isolated, Bitcoin is simply the latest destination in a market that has rotated between themes for months.
One theme waking up is important. It is not the same as the entire market waking up.
Rates and AI Spending Create the Week’s Central Test
The immediate test is whether growth leadership can keep working with yields firm. Higher short term rates raise the bar for long duration assets, while the AI infrastructure cycle is still creating real demand across semiconductors, networking, servers, software, and data center suppliers. The headlines point in opposite directions; the market’s response will tell us which force actually matters.
I do not need to predict the next Fed decision or estimate the ultimate return on every dollar of AI capital spending. The useful question for my process is simpler: can growth leadership continue to hold support and produce follow through if yields remain firm? If it can, that would be meaningful evidence of underlying demand. If strong fundamental headlines continue producing brief rallies that are quickly sold, the market will be confirming the same rotational character that has existed since late May.
Small Caps Are a Warning
SPY and QQQ remain above their major longer term moving averages, but that resilience is being supported disproportionately by large cap leadership. IWM provided the clearer warning Friday, weakening sharply and slipping below short term support. The divergence shows that risk appetite is not expanding consistently beyond the market’s largest companies.
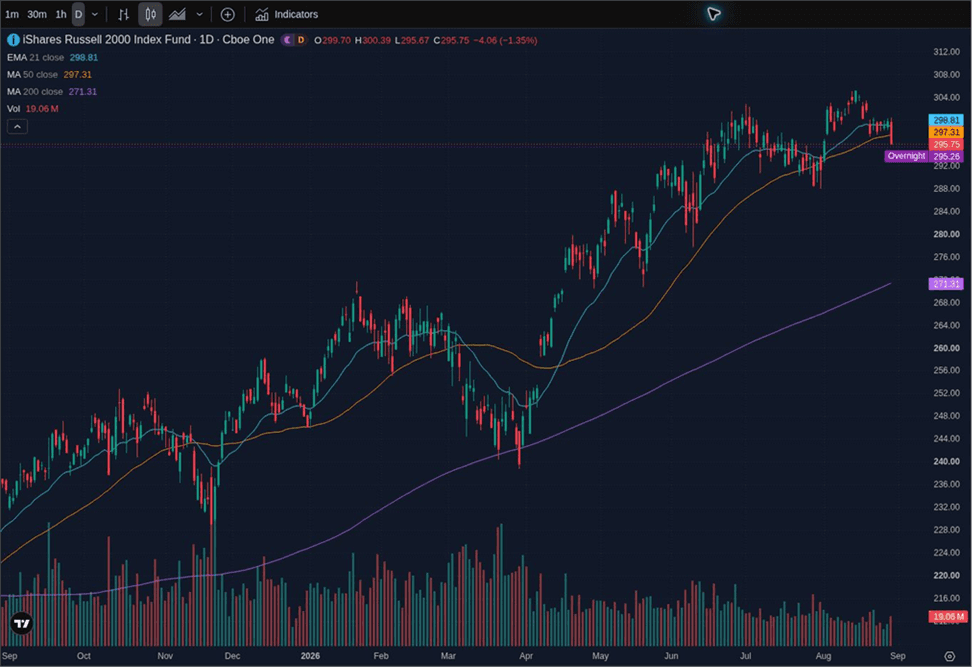
IWM weakened sharply Friday and lost short term support, showing that risk appetite is not expanding consistently beyond the largest companies.Moving average guide: 21 day EMA (baby blue), 50 day SMA (orange), and 200 day SMA (purple). Source: TradingView. Analysis: GB Capital. Price data through August 28, 2026.
I frame breadth through observable confirmation rather than a third party stage count: index resilience, small cap participation, leadership persistence, setup quantity, and the feedback from actual positions. Those signals remain mixed. The dashboard below makes that tension explicit.
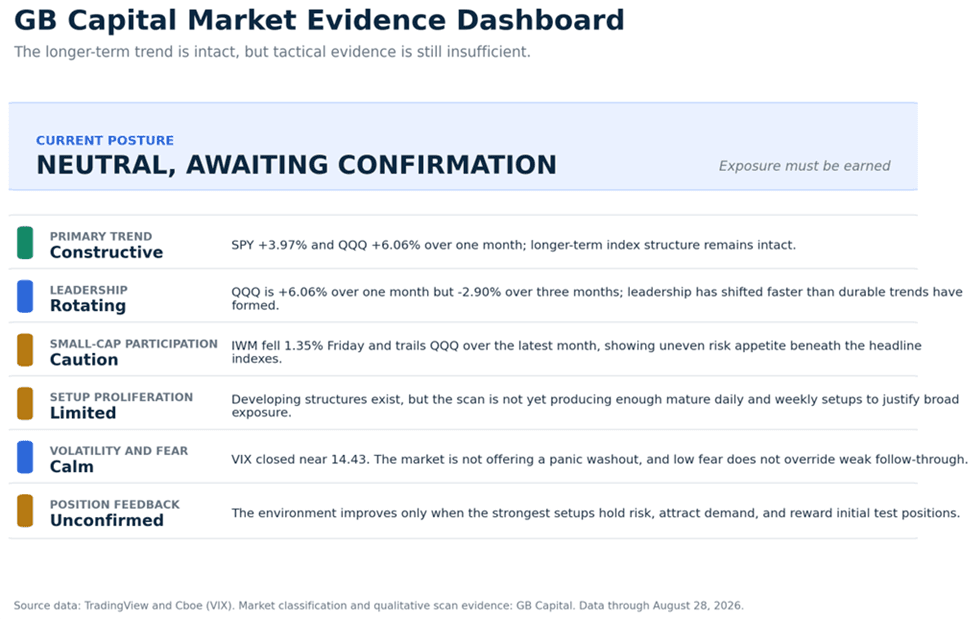
The evidence is mixed. The longer term index trend remains intact, but rotating leadership, weak small cap participation, limited setup proliferation, and unconfirmed position feedback keep the tactical posture neutral.
The indexes provide context. The stocks themselves determine whether the environment is producing attractive opportunities. Mega cap strength can keep SPY and QQQ resilient, but it cannot make an incomplete setup actionable.
The Most Important Indicator Is Setup Proliferation
The number and quality of setups matter more to my process than whether an index is a few percentage points above or below a moving average.
When conditions are genuinely improving, I see an expanding number of liquid leaders with strong relative strength, important themes, healthy daily and weekly trends, mature consolidations, contracting volatility, and entries close enough to support that risk can be clearly defined.
When those characteristics begin appearing across multiple groups, I do not have to convince myself that the market is healthy. Watchlists expand naturally, breakout attempts hold, pullbacks remain constructive, and early positions begin working. That has not been the market’s consistent feedback since late May.
There are developing structures across several areas, but there is not yet a proliferation of completed setups. That keeps my aggression below normal. The market is still asking for selectivity rather than broad exposure.
DRAM Is a Developing Signal, Not a Confirmed Setup
The Roundhill Memory ETF, DRAM, is a useful illustration of the repair process now occurring in former leadership because memory is attempting to stabilize after a substantial correction.
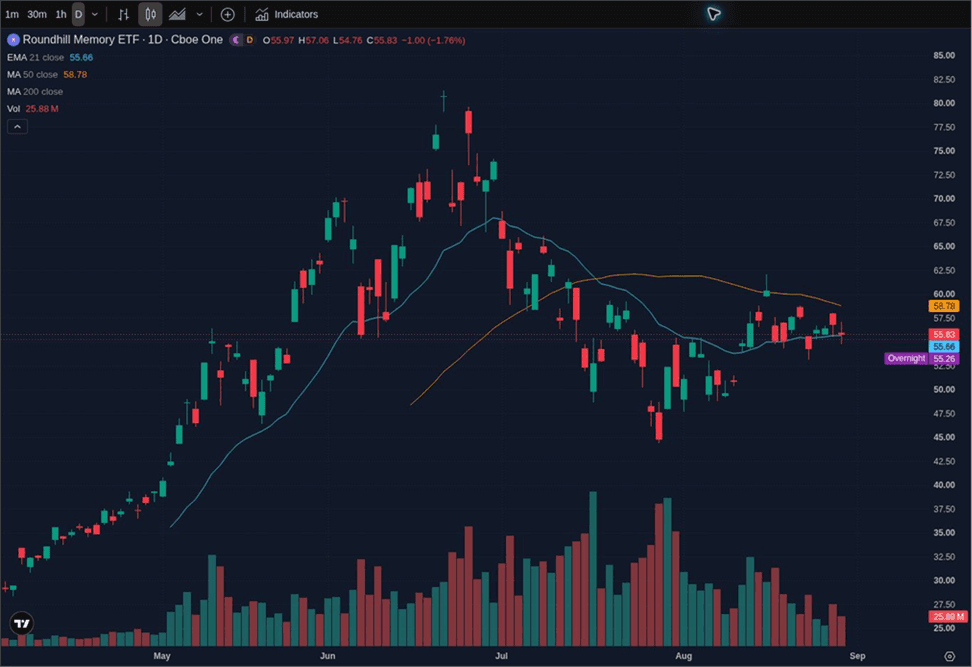
DRAM gained 17.22% over the latest month but remained down 12.02% over three months. That is a repair attempt, not yet evidence of a fully restored trend . Moving average guide: 21 day EMA (baby blue), 50 day SMA (orange), and 200 day SMA (purple). DRAM does not yet have 200 trading sessions, so its 200 day SMA is not plotted. Source: TradingView. Analysis: GB Capital. Price data through August 28, 2026.
Memory is interesting precisely because it has not been working. The prior leadership phase ended with a substantial correction, enthusiasm diminished, and the group moved out of focus. The daily structure is now beginning to tighten, which suggests the decline may be transitioning into a base building process.
Under my normal framework, this is not yet a confirmed setup. DRAM remains beneath an important 50 day moving average, and the broader semiconductor theme has not established sustained leadership. I am using the chart as an example of base development, not as a recommendation to buy the ETF.
A successful reclaim of the 50 day average, continued volatility contraction, improving relative strength, and stronger price and volume behavior would materially improve the evidence. The potential is worth monitoring. Price still has to confirm it.
What This Market Actually Supports
Continue holding legitimate leaders while their individual trends remain intact.
Monitor former leaders as their new bases mature.
Begin with smaller test positions in the strongest opportunities rather than starting at maximum exposure.
Add exposure only after price and volume provide confirmation.
Require entries to offer clearly defined risk and enough potential reward to justify the trade.
Pass on average setups simply because cash is available.
Keep correlated technology exposure under control.
Allow the number and quality of opportunities to determine aggression.
This environment does not support filling a portfolio simply because SPY and QQQ remain above their longer term moving averages. Cash is not automatically a bearish position. In a market producing limited follow through, it is capital reserved for a period when high quality setups become difficult to ignore.
Exposure should be earned rather than assumed. Initial positions function as information: if the strongest setups hold their risk levels, make progress, and attract continued demand, I can add incrementally. If they stall or fail, that is direct market feedback to keep portfolio heat contained, regardless of what the indexes or macro narrative appear to suggest.
What Would Change My View?
Evidence That Would Make Me More Aggressive
QQQ breaks out of the range that has existed since late May.
IWM quickly reclaims the short term support lost Friday.
Breadth improves beyond the largest index weights as participation expands across multiple sectors and market cap ranges.
Leadership spreads from Bitcoin and software into semiconductors, memory, fiber optics, financial technology, and other growth areas.
Former leaders complete their bases and the number of mature daily and weekly setups expands.
Breakouts hold their initial gains and early test positions produce a consistent string of positive outcomes.
The final three conditions matter most. A market does not become healthier because more charts temporarily look interesting. It becomes healthier when completed setups begin working.
Evidence That Would Make Me More Defensive
SPY and QQQ lose their 50 day moving averages as volatility rises.
IWM remains below support and continues underperforming.
Breadth deteriorates materially as small caps and former leaders remain under sustained pressure.
Existing leaders begin breaking intermediate term support.
Developing bases fail before reaching maturity and the number of viable setups continues shrinking.
Breakouts continue producing short term movement without lasting follow through.
I do not need to predict which outcome comes next. I need to know what evidence would require a different response.
Risk Appetite Is Calm, but Not Confirmed
The VIX closed Friday at 14.42, indicating relatively muted expectations for near term volatility. Friday’s weakness did not produce panic or a meaningful rush for protection.
Low fear can coexist with narrow leadership and poor breakout follow through. A calm volatility reading is useful context, but it is neither a contrarian washout signal nor proof that investors are broadly embracing risk.
For my process, price, participation, leadership, setup proliferation, and position feedback remain the deciding evidence. Sentiment can describe the environment; it does not overrule what the market is actually rewarding.
What I Am Watching This Week
Friday’s August employment report, scheduled for 8:30 a.m. ET, is the week’s main macro catalyst. With the Federal Reserve’s September meeting approaching, the report could influence yields and create additional volatility. I am less interested in predicting the number than in observing whether the market can absorb it.
The AI infrastructure cycle will also face an important earnings test: Dell reports Tuesday, followed by Broadcom and HPE on Wednesday. These are not events to guess in advance. They are opportunities to measure whether good news produces sustained price acceptance and whether strength spreads into related groups.
Whether QQQ and SPY hold their short term moving averages.
Whether IWM reclaims Friday’s loss of support.
Whether Bitcoin holds its recent expansion.
Whether software continues strengthening.
Whether memory and semiconductor bases continue maturing.
Whether leading stocks absorb volatility without breaking down.
Whether new breakouts begin producing actual follow through.
The response of actual positions will be the final test. Constructive index action matters, but the environment has not truly improved until the strongest setups begin working, holding support, and rewarding disciplined risk.
The Bottom Line
My current tactical posture is neutral and evidence dependent.
The longer term index backdrop remains constructive: primary trends are intact, mega cap leadership continues working, speculative appetite is reappearing in Bitcoin, and several former technology leaders are attempting to build new bases. Those are legitimate reasons to remain engaged.
However, QQQ has been chopping since late May, small caps weakened materially Friday, participation remains uneven, and the market continues struggling to turn short term movement into sustained trends. Those are equally legitimate reasons not to press.
For now, the edge is in holding proven leaders, monitoring former leaders as their structures repair, testing only exceptional new opportunities, and making the market prove that the next breakout can finally become something more than another short term move.
Sources and Disclosures
Investment framework: The Investment Process: From Leadership to Position Management
Original visuals: GB Capital Leadership Monitor and GB Capital Market Evidence Dashboard. ETF proxy selection, market classification, and qualitative scan evidence: GB Capital. Price return source data: TradingView. VIX source: Cboe.
Index and ETF charts: TradingView, displayed with attribution. Analysis and interpretation: GB Capital.
Market volatility: Cboe VIX data
Economic calendar: U.S. Bureau of Labor Statistics release schedule
Federal Reserve context: Chair Kevin Warsh remarks at Jackson Hole, August 28, 2026
AI infrastructure earnings calendar: Dell Investor Relations; Broadcom Investor Relations; HPE Investor Relations
This material is provided for informational and educational purposes only and should not be construed as investment advice or a recommendation to buy or sell any security. |